Motion charts can be obtained by using page shelf.
A simple motion chart can be a change in sales over different years or the growth of the sum of sales over the years.
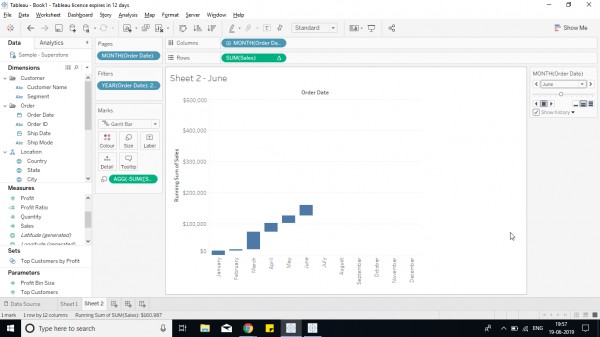
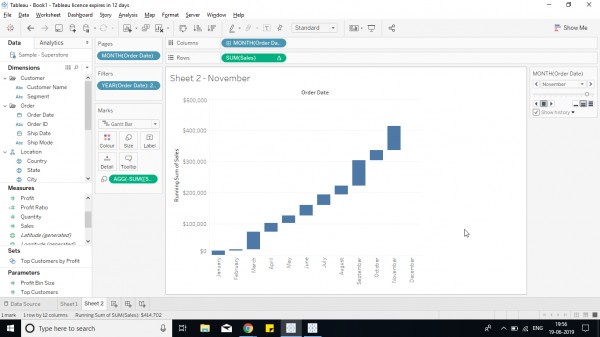
For example to create a waterfall chart to show the running sales over months in a year-
- Drop the Month of the date field in page and column shelf.
- SUM([Sales]) in Row shelf and add quick calculation of running total.
- AGG(-SUM([Sales])) in Size shelf.
- Select show history and select All for show history and select show marks under show history window.
Final visual would be seen as below -
Hope it helps!
Want to be an expert in Tableau? Check out the Tableau Training to get the right assistance.