Truncated normal distribution:
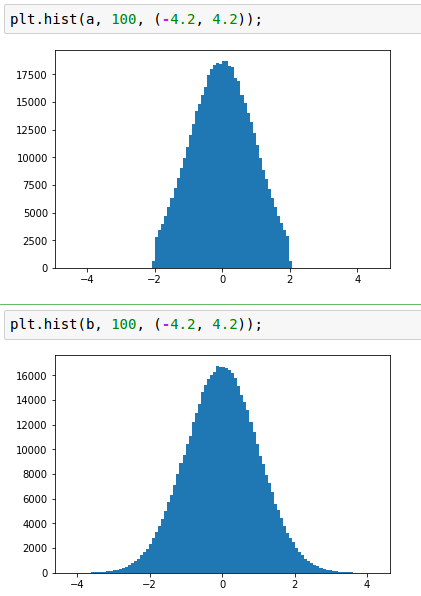
The values generated from this function follows a normal distribution with specified mean and standard deviation, except that values whose magnitude is more than 2 standard deviations from the mean are dropped and re-picked.

It is easy to understand the difference by plotting the graph for yourself (%magic is used because I use jupyter notebook):
Code to plot graph:
import tensorflow as tf
import matplotlib.pyplot as plt
%matplotlib inline
n = 500000
A = tf.truncated_normal((n,))
B = tf.random_normal((n,))
with tf.Session() as sess:
a, b = sess.run([A, B])
plt.hist(a, 100, (-4.2, 4.2)); plt.hist(b, 100, (-4.2, 4.2));

The raeson for using truncated normal is to overcome saturation of time functions like sigmoid.