To change the size of the points in R scatterplot, you can use the cex argument.
According to R Documentation:
cex
A numerical value giving the amount by which plotting text and symbols should be magnified relative to the default. This starts at 1 when a device is opened and is reset when the layout is changed, e.g. by setting mfrow.
cex.axis
The magnification to be used for axis annotation relative to the current setting of cex.
cex.lab
The magnification to be used for x and y labels relative to the current setting of cex.
cex.main
The magnification to be used for main titles relative to the current setting of cex.
cex.sub
The magnification to be used for subtitles relative to the current setting of cex
For example:
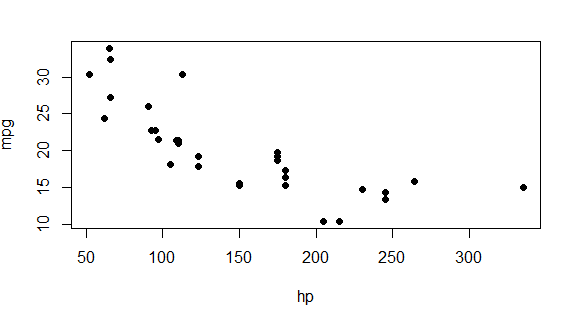
data(mtcars)
plot(mpg ~ hp, data = mtcars, pch = 20, cex = 1.5)
pch = 20:- bullet (smaller solid circle, 2/3 the size of 19),
cex =1.5 :- To magnify to 150 percent.
Output: