Hi Vaibhav,
Funnel chart is normally used in sales or to track control over leads for marketing/sales companies.
Follow these steps to create a simple funnel chart:
For suppose if you want to show the leads for a company product.
1. Select the phases and the number of leads and make a bar graph.
2. Sort the phases as per requirement (for ex: marketing->sales->customer)
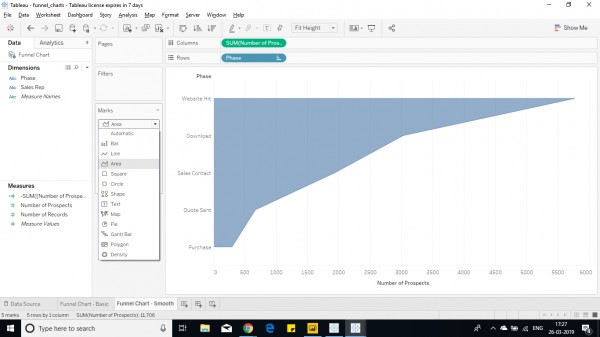
3. Convert the bar to area chart from marks pane.
4. Now Create calculated field as - number of leads/visitors.
5. Drop the field into shelf to make it symmetric.
6. Now add the labels and format the graph as per requirement.
Hope this help you.
Want to be an expert in Tableau? Check out the Tableau Training to get the right assistance.