In your case, k-means clustering can be implemented using Elbow Criterion, if the true labels are known in advance.
Elbow Criterion Method:
The idea behind the elbow method is to implement k-means clustering on a given dataset for a range of values of k (num_clusters, e.g k=1 to 10), and for each value of k, calculate the sum of squared errors (SSE).
Elbow method plot a line graph of the SSE for each value of k. If the line graph looks like an arm - a red circle in the below line graph, the "elbow" on the arm is the value of optimal k (number of the cluster). K-means is used to minimize SSE. SSE tends to decrease toward 0 as we increase k and SSE is 0 when k is equal to the number of data points in the dataset, because then each data point is its own cluster, and there is no error between it and the center of its cluster.
So the goal is to choose a optimal value of k that still has a low SSE, and the elbow usually represents where we start to have diminishing returns by increasing k.
For Example:
from sklearn.cluster import KMeans
import matplotlib.pyplot as plt
sse = {}
for k in range(1, 10):
kmeans = KMeans(n_clusters=k, max_iter=1000).fit(data)
data["clusters"] = kmeans.labels_
print(data["clusters"])
sse[k] = kmeans.inertia_ # Inertia: Sum of distances of samples to their closest cluster center
plt.figure()
plt.plot(list(sse.keys()), list(sse.values()))
plt.xlabel("Number of cluster")
plt.ylabel("SSE")
plt.show()
Plot for above code: enter image description here
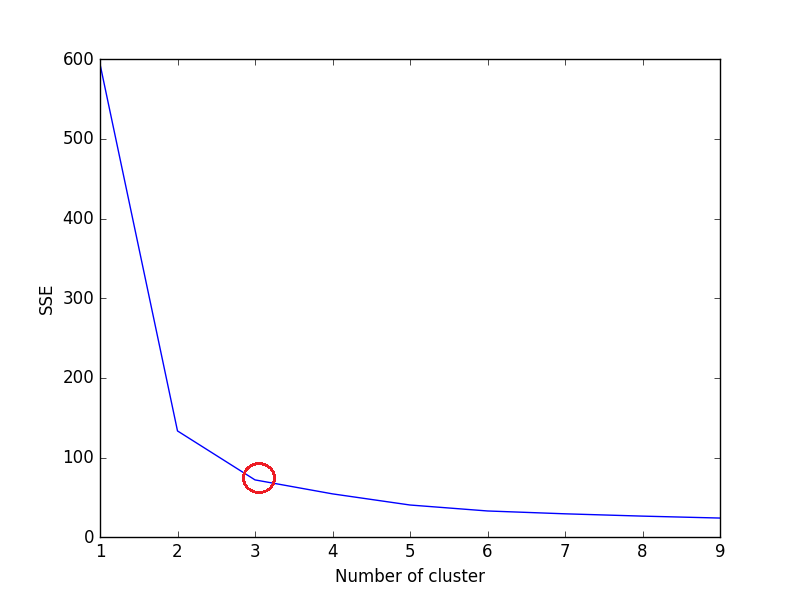
We can see in the above plot, 3 is the optimal number of clusters (encircled red) for this dataset, which is indeed correct.
Hope this answer helps.