To illustrate the difference lets take a case when you have 2 arguments in facet_grid() or facet_wrap().
facet_grid(x ~ y) will display x*y plots even if some plots are empty. Ex:
library(ggplot2)
g <- ggplot(mpg, aes(displ, hwy))
g + geom_point(alpha=1/3) + facet_grid(cyl~class)
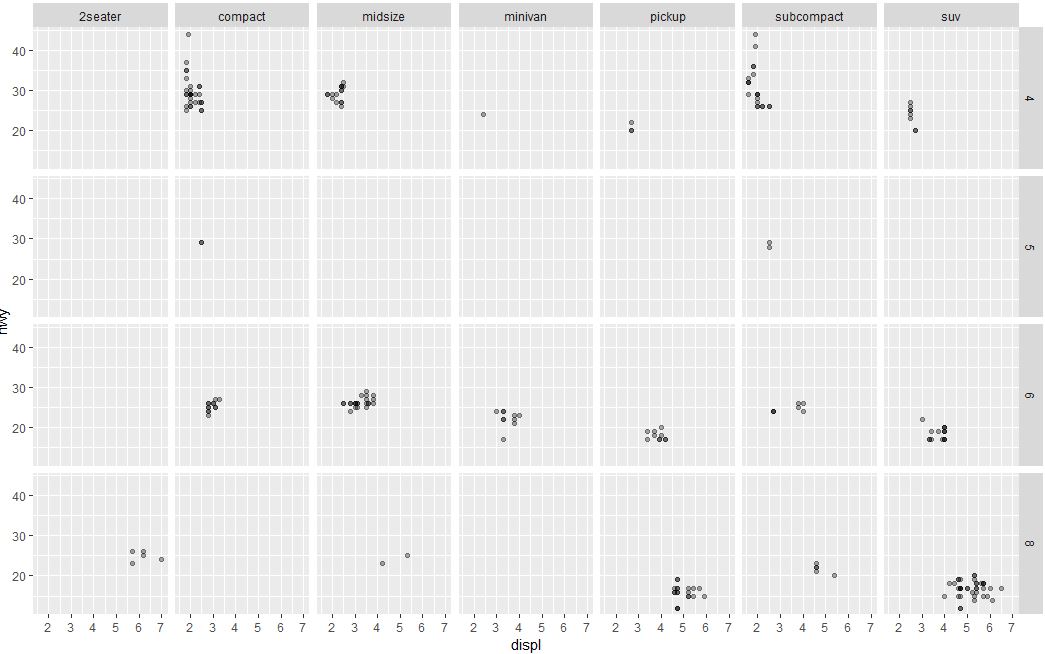
There are 4 distinct cyl and 7 distinct class values.
The above displays 4 * 7 = 28 plots, even if some are empty (because some classes do not have corresponding cylinder values, like rows with class="midsize" doesn't have any corresponding cyl="5" value )
facet_wrap(x ~ y) on the other hand, displays only the plots having actual values.i.e.,
g + geom_point(alpha=1/3) + facet_wrap(cyl~class)
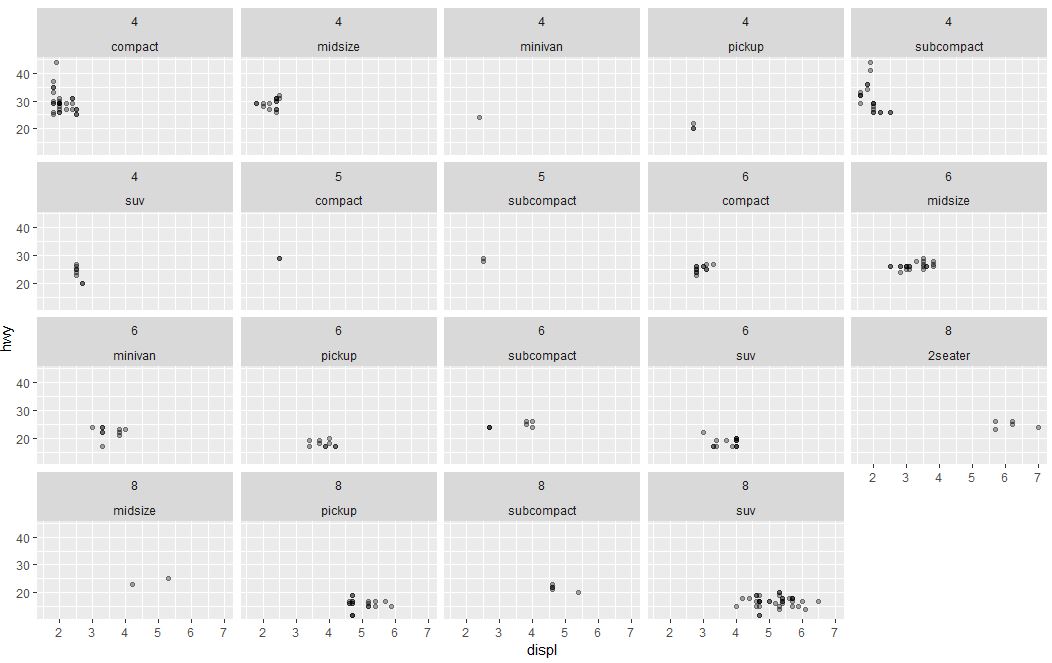
There are 19 plots displayed now, one for every combination of cyl and class.
If you want to learn more about R programming watch this tutorial on Introduction to Data Science with R