To plot a legend outside the plotting area in base graphics, you can set the xpd argument of the par function.
According to R Documentation:
xpd
A logical value or NA. If FALSE, all plotting is clipped to the plot region, if TRUE, all plotting is clipped to the figure region, and if NA, all plotting is clipped to the device region.
In your case:
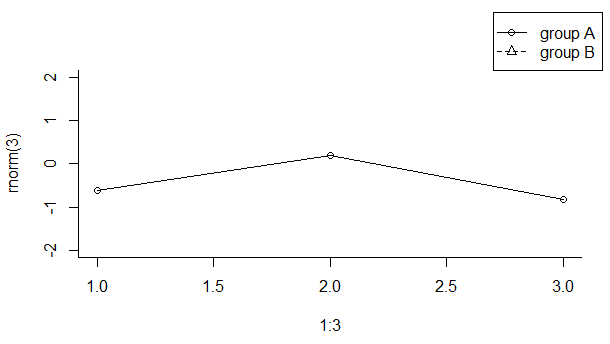
set.seed(1)
plot(1:3, rnorm(3), pch = 1, lty = 1, type = "o", ylim=c(-2,2), bty='L')
par(xpd=TRUE)
legend(2.7,3.5,c("group A", "group B"), pch = c(1,2), lty = c(1,2))
Output: