Back

Explore Courses Blog Tutorials Interview Questions
0 votes
2 views
in Data Science by (50.2k points)

Suppose I have the following code that plots something very simple using pandas:

 import pandas as pd

values = [[1, 2], [2, 5]]

df2 = pd.DataFrame(values, columns=['Type A', 'Type B'], 

                   index=['Index 1', 'Index 2'])

df2.plot(lw=2, colormap='jet', marker='.', markersize=10, 

         title='Video streaming dropout by category')

image

How do I easily set x and y-labels while preserving my ability to use specific colormaps? I noticed that the plot() wrapper for pandas DataFrames doesn't take any parameters specific to that.

1 Answer

0 votes
by (108k points)

The df.plot() function returns a matplotlib.axes.AxesSubplot object. You can set the labels on that object.

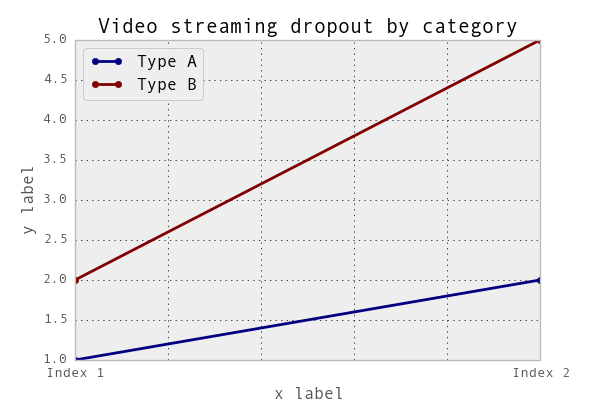
In [4]: ax = df2.plot(lw=2, colormap='jet', marker='.', markersize=10, title='Video streaming dropout by category')

In [6]: ax.set_xlabel("x label")

Out[6]: <matplotlib.text.Text at 0x10e0af2d0>

In [7]: ax.set_ylabel("y label")

Out[7]: <matplotlib.text.Text at 0x10e0ba1d0>

image

Or, more succinctly: ax.set(xlabel="x label", ylabel="y label").

Automatically, the index x-axis label is set to the Index name if it has one. so df2.index.name = 'x label' would work.

If you are interested to learn Pandas visit this Python Pandas Tutorial.

Browse Categories

...