Your cart is currently empty.
Watch
Course PreviewThe Advanced Certification Program in Data Analytics builds practical skills across business reporting, data preparation, statistical analysis, dashboarding and AI-assisted automation. Learners work with Excel, SQL, Python and Power BI before progressing to Generative AI, RAG, analytics agents and workflow orchestration.
The program follows an AI-first learning path that connects analytics fundamentals with modern business tools and workflows.
Organizations rely on analysts to convert operational data into clear reports, reliable KPIs and practical recommendations. Data analytics skills are used across finance, marketing, sales, product, operations, healthcare, retail and technology, making the field suitable for both fresh graduates and working professionals.
A Data Analyst collects, cleans, analyzes and presents data to support business decisions. Typical responsibilities include preparing datasets, tracking KPIs, building reports and dashboards, identifying trends, testing assumptions and communicating recommendations to stakeholders.
No advanced programming experience is required. Basic computer knowledge, logical thinking and an interest in working with data are sufficient to begin.
| Role | Primary Focus | Core Skills |
| Data Analyst | Cleans, analyzes and interprets data to identify trends and support decisions. | Excel, SQL, Python, statistics and visualization |
| BI Analyst | Builds dashboards, semantic models and recurring business reports. | Power BI, DAX, Power Query, SQL and data modeling |

| Business Analyst | Translates business requirements into process improvements, KPIs and recommendations. | Requirements analysis, KPIs, Excel, SQL and communication |
Talk To Us
We are happy to help you 24/7
55% Average Salary Hike
$1,22,000 Highest Salary
40 LPA Highest Salary
10000+ Career Transitions
3100+ Hiring Partners
Career Transition Handbook
*Past record is no guarantee of future job prospects
Prepare, analyze and visualize data to support business decisions.
Build dashboards, DAX measures and recurring performance reports.
Create automated MIS reports, KPI trackers and management summaries.
Translate business needs into analytical questions, metrics and recommendations.
Measure campaign, funnel, acquisition and conversion performance.
Analyze activation, engagement, retention and feature adoption.
Use Python, APIs and workflow tools to automate recurring analytics tasks.
Track service levels, demand, productivity and process performance.
Data Cleaning
Advanced Excel
Power Query
SQL
Python
EDA
Statistics
Power BI
DAX
Data Modeling
KPI Analysis
AI Analytics
Prompt Engineering
RAG
Agentic AI
n8n Automation
Data Storytelling
Stakeholder Communication
EMI Starts at
₹5,000
We partnered with financing companies to provide very competitive finance options at 0% interest rate
Financing Partners
Contact Us
Understand how modern analytics teams use data, business context and AI-assisted tools to solve real-world problems.
Transform raw operational data into automated reports, MIS dashboards and actionable business insights.

Microsoft Excel & advanced topics
Power Query
AI-Assisted Reporting
Hands-on Project: Automated Monthly Sales and MIS Performance Report
Build strong SQL skills to retrieve, clean, transform and analyse business data.
SQL Foundations
Data Preparation
Business Analytics Using SQL
Hands-on Project: E-commerce Customer, Product and Revenue Analytics
Use modern Python to clean data, perform analysis and automate recurring analytics workflows.

Python Foundations
Data Analytics Using Python
Automation and APIs
Hands-on Project: Automated Business Data-Cleaning and Analytics Pipeline
Use statistical reasoning and experimentation to validate insights and support data-driven decisions.

Statistics Fundamentals
Hypothesis Testing
EDA & Business Experimentation
Hands-on Project
Product Conversion & Customer Engagement A/B Test — Analyse experiment results, validate conversion impact and present data-backed business recommendations.
Build interactive dashboards and use analytics to solve finance, marketing, sales, product and operational problems.
Power Query in Power BI
Data Modelling
DAX
Dashboard Development
Power BI Service
Explore how Generative AI can accelerate data analysis, automate business insights and enable intelligent interactions with organisational data.
Hands-on Exercise: Create a basic AI analytics assistant that answers questions from a business document or dataset.
Understand how AI agents can use data, tools and automated workflows to complete multi-step analytics tasks.
Hands-on Exercise: Design a basic analytics workflow that collects data, generates insights and prepares an automated business report.
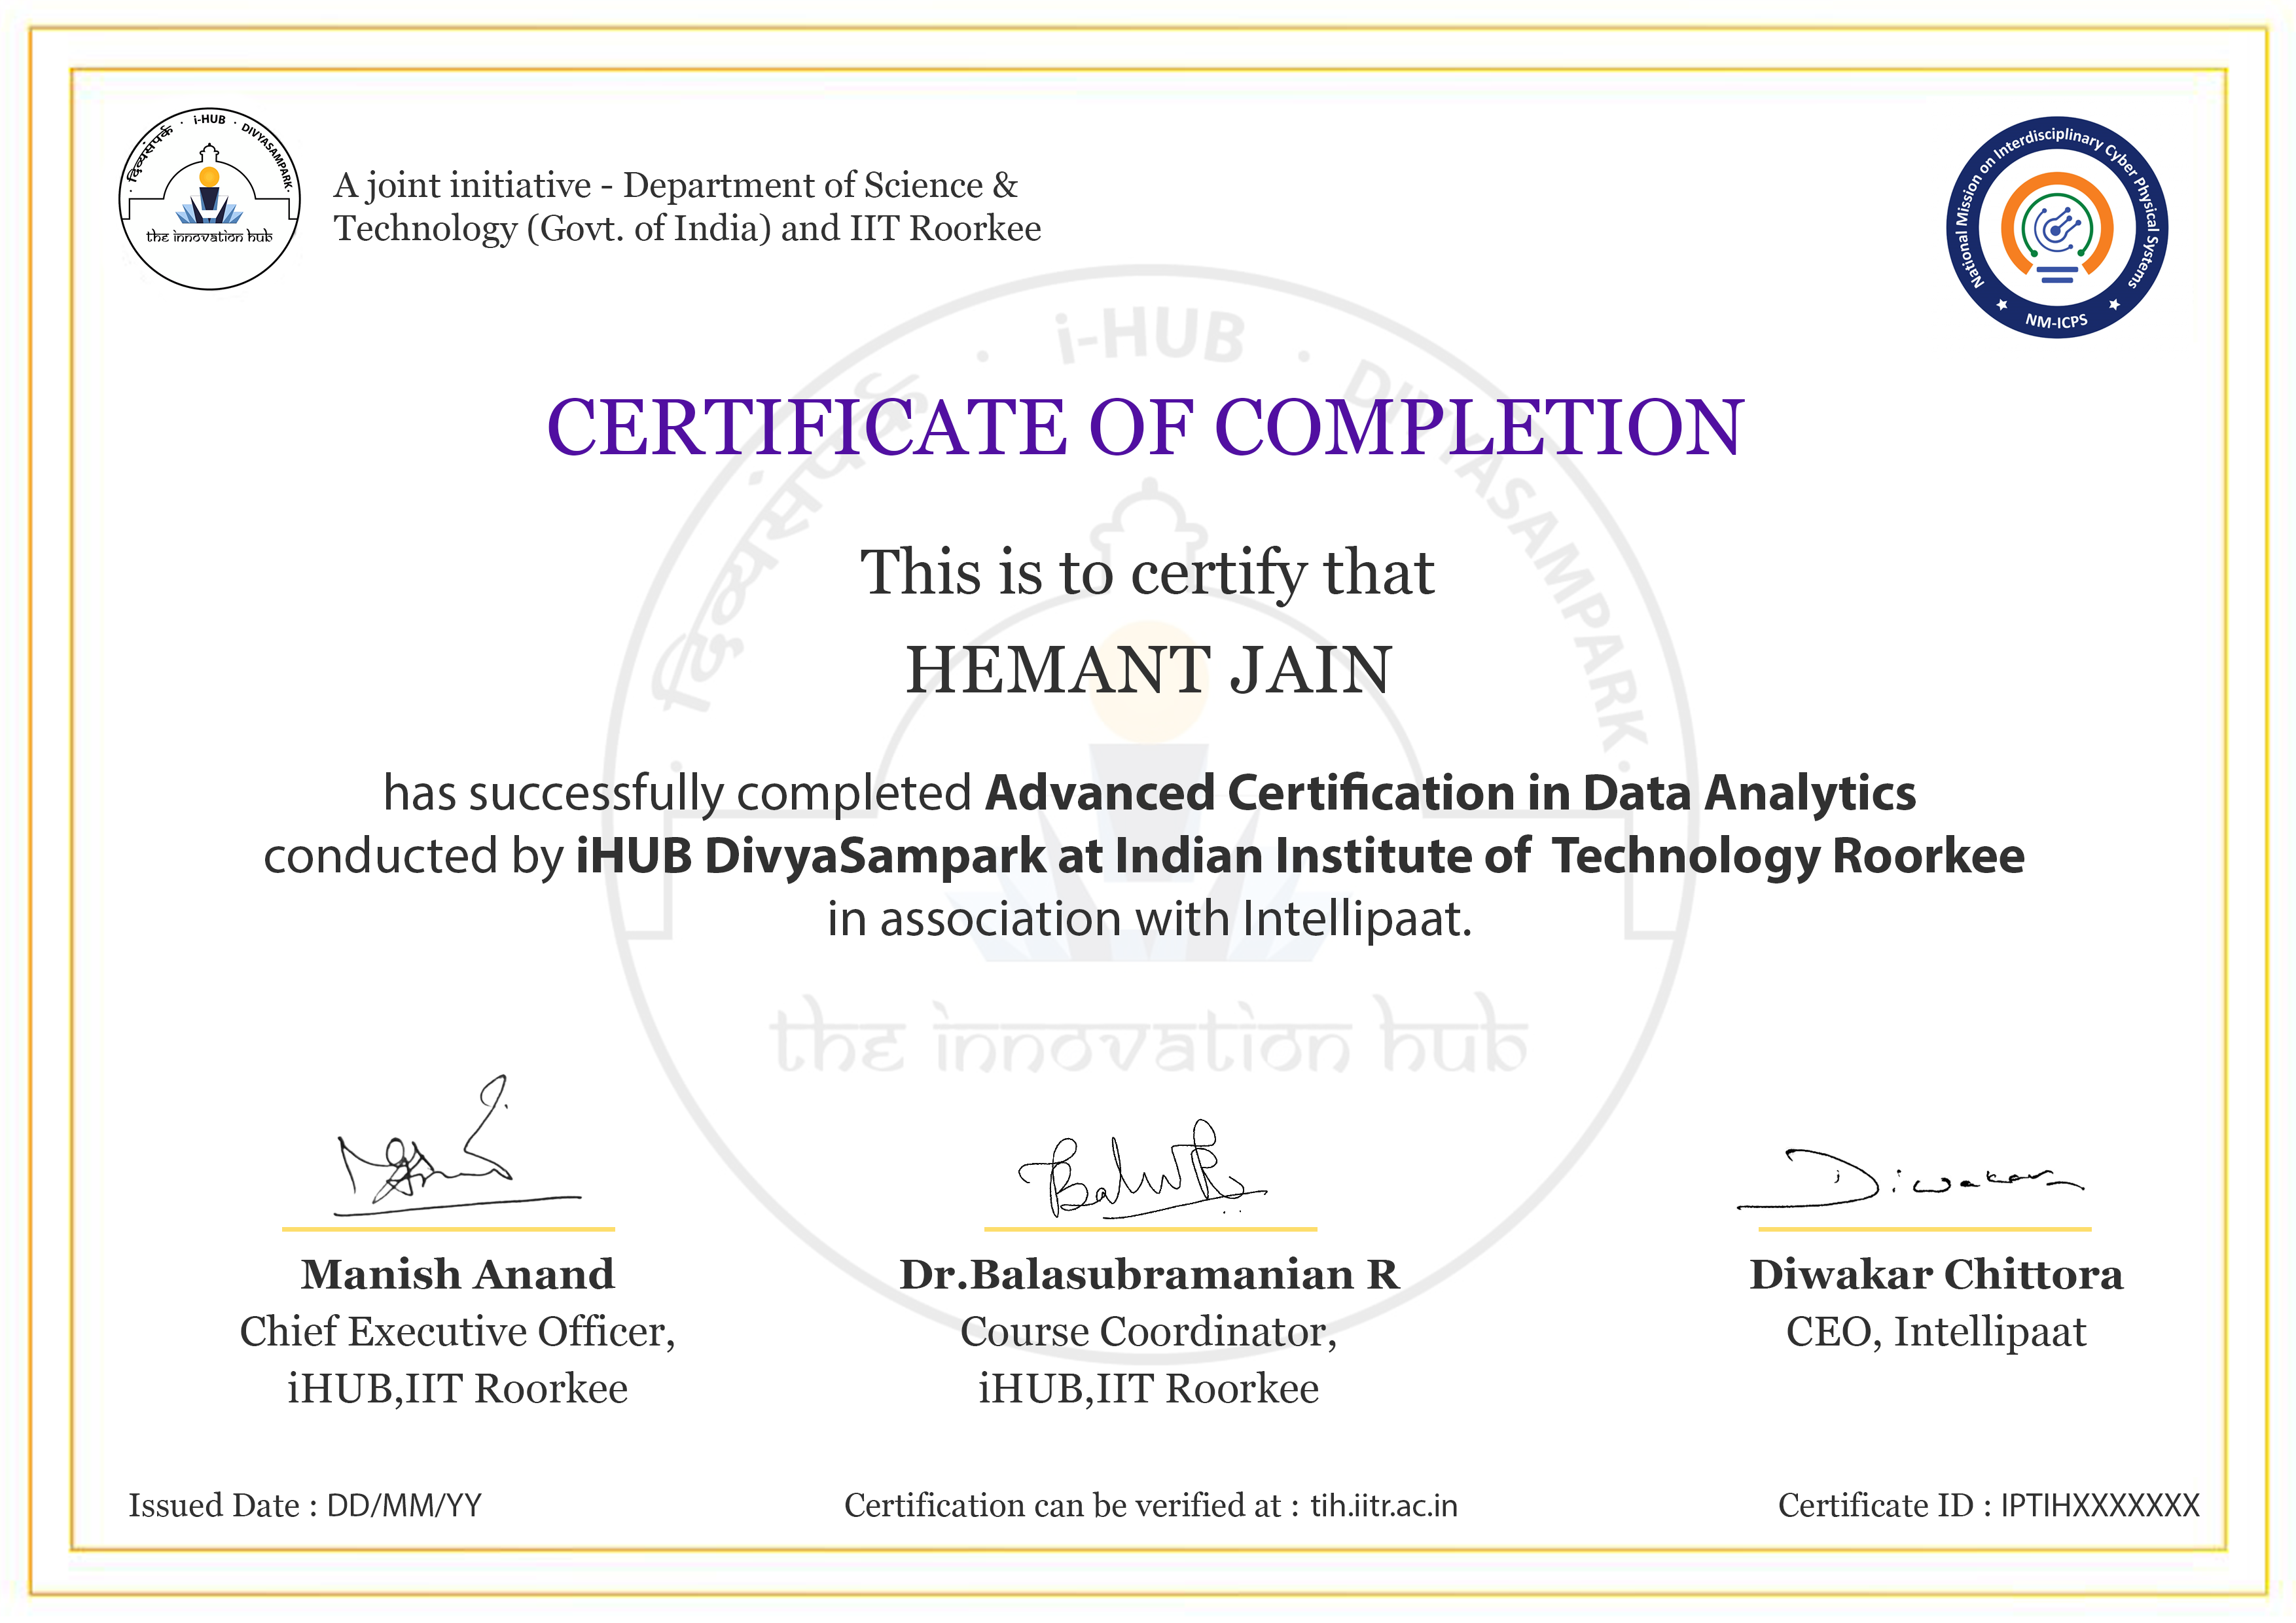
Earn the Advanced Certification Program in Data Analytics credential from iHUB IIT Roorkee after completing the required modules, assessments and projects. The program validates practical skills across Excel, SQL, Python, statistics, Power BI, Generative AI, RAG and analytics automation.
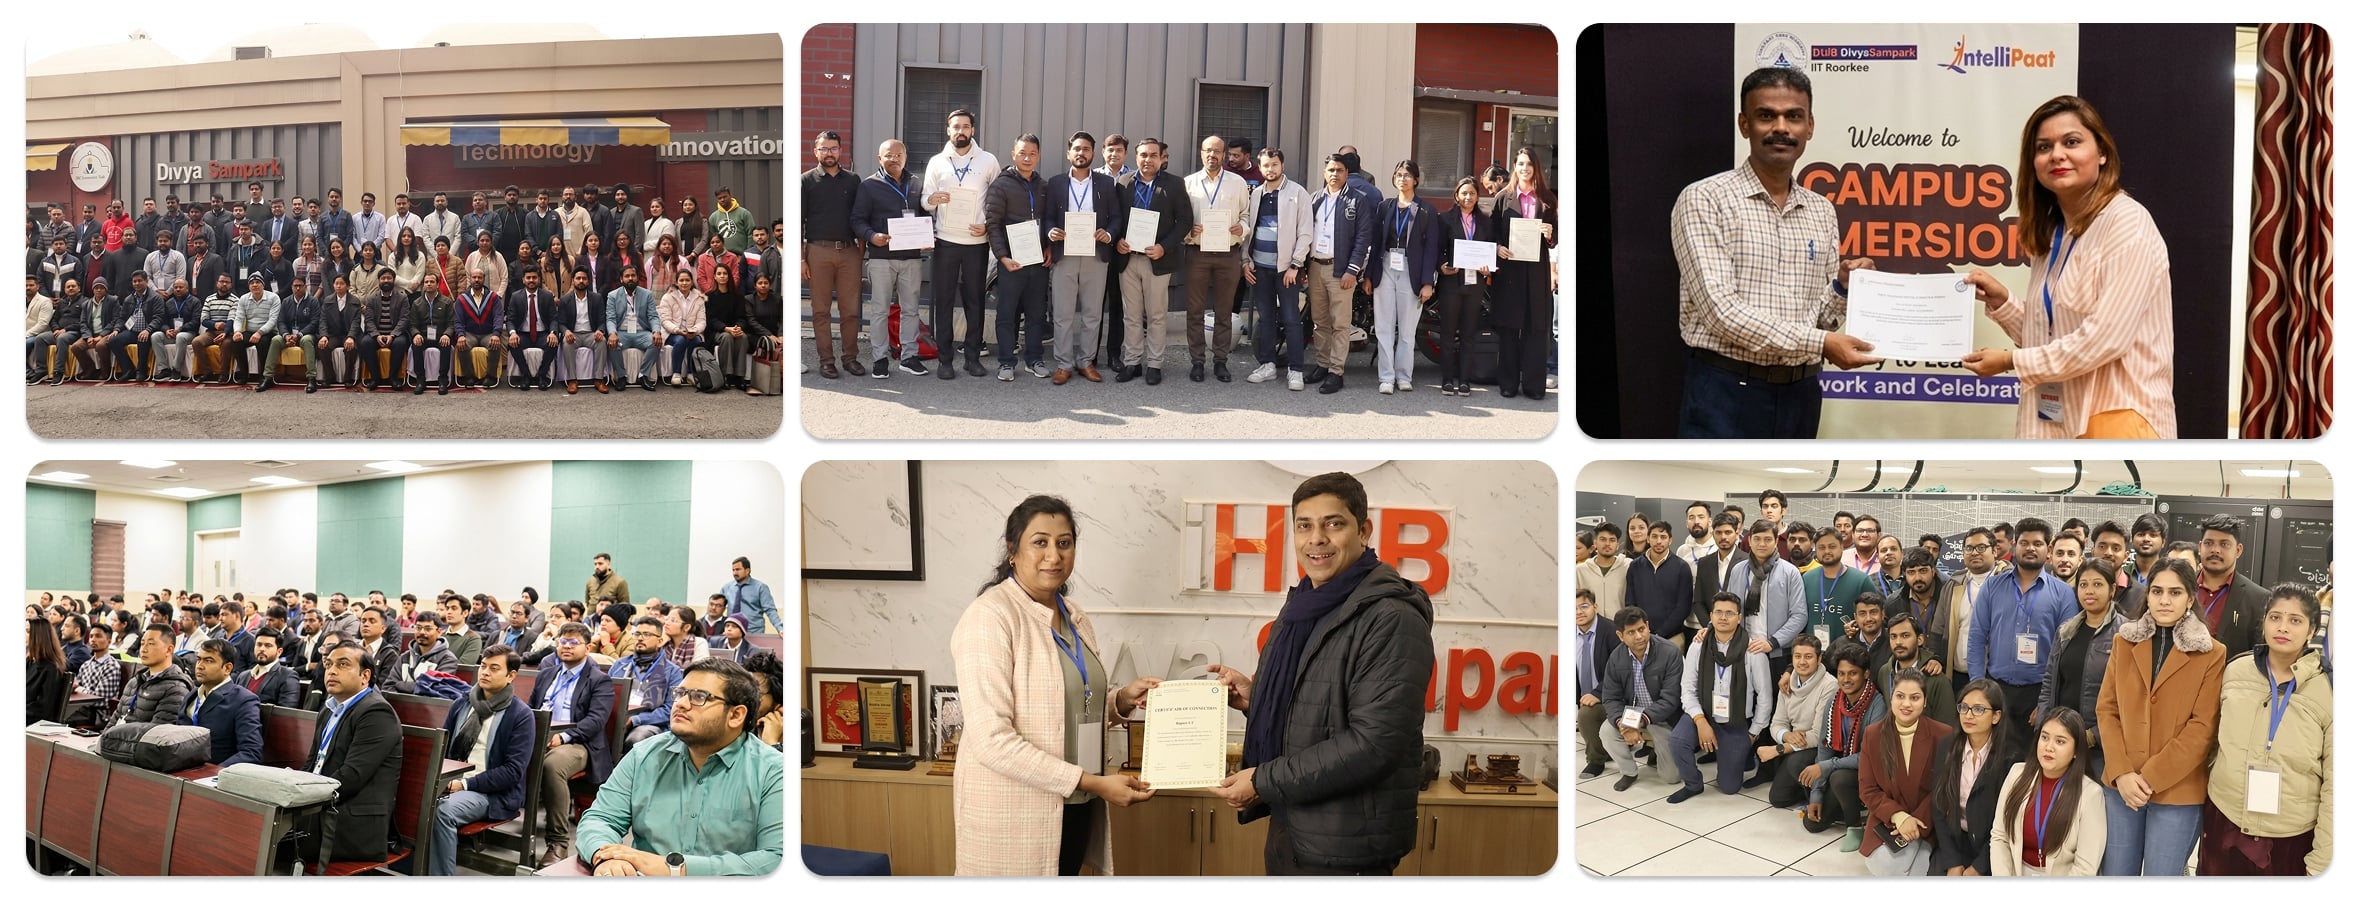
Experience Campus Immersion at iHub IIT Roorkee & Build Formidable Networks With Peers & IIT Faculty
Land Your Dream Job Like Our Alumni
The eight core modules include 128 hours of live learning, along with hands-on exercises and industry-aligned projects.
The program covers Excel, Power Query, SQL, Python, Jupyter Notebook, Power BI, ChatGPT, GitHub Copilot, OpenAI APIs, LangChain, n8n and GitHub.
Yes. Learners use Generative AI for formulas, SQL, Python, DAX, EDA, summaries and basic analytics assistants.
Yes. The curriculum introduces analytics agents, tool use, task decomposition, n8n workflows, human approvals and guardrails.
The program includes 10 industry-aligned projects across retail, travel, healthcare, fintech, hospitality, marketing and service operations.
Yes. R Programming and Big Data & Spark are available as self-paced electives.
Relevant roles include Data Analyst, BI Analyst, Reporting Analyst, Business Analyst, Marketing Analyst, Product Analyst and Operations Analyst.
Yes. The Power BI module covers Power Query, data modeling, DAX, dashboards, Power BI Service, security and AI-assisted reporting.
Yes. The course covers descriptive statistics, probability, confidence intervals, hypothesis testing, effect size, EDA and A/B testing.
Yes. The structured learning path is suitable for graduates and working professionals from technical or non-technical backgrounds.
Learners validate AI-generated outputs and study groundedness, hallucinations, privacy, secure API usage, guardrails and controlled execution.
Learners must complete the required modules, assessments and projects according to the program guidelines.
Click to Zoom