Your cart is currently empty.
Intellipaat’s Data Science with R programming course will help you be a master in data manipulation with R, data visualization, and advanced analytics topics like regressions and data mining using RStudio. During this R Programming course, you will get training on real-life projects and assignments to master Data Science skills.

Watch
Course PreviewRead More
This R course helps you master concepts like:
Intellipaat’s Data Science with R course is exclusively designed by industry experts for:
We don’t expect any prior knowledge from your side for this R certification course. However, a basic knowledge of programming language can be helpful to acquire R programming skills.
You should sign up for our R programming training because:
R programming is a statistical language for Data Science specialization that is finding higher adoption rates today, thanks to its extensible nature. It can be widely deployed for various applications and can be easily scaled. Taking up this Data Science with R certification training to learn various tools in R programming will therefore help you grab high-paying jobs offered by large companies.
Talk To Us
We are happy to help you 24/7
₹14,022
Contact Us
R language for statistical programming, various features of R, introduction to RStudio, statistical packages, familiarity with different data types and functions, learning to deploy them in various scenarios, use SQL to apply ‘join’ function, components of RStudio like code editor, visualization and debugging tools and learn about R-bind
R functions, code compilation, and data in well-defined format called R Packages, R Package structure, package metadata and testing, CRAN (Comprehensive R Archive Network), vector creation and variables values assignment
R functionality, Rep function, generating repeats, sorting and generating factor levels, transpose and stack function
Introduction to matrix and vector in R, understanding various functions like Merge, Strsplit, Matrix manipulation, rowSums, rowMeans, colMeans, colSums, sequencing, repetition, indexing and other functions
Understanding subscripts in plots in R, how to obtain parts of vectors, using subscripts with arrays, as logical variables, with lists and understanding how to read data from external files
Generate plots in R, graphs, bar plots, line plots, histograms and components of a pie chart
Understanding analysis of variance (ANOVA) statistical technique, working with pie charts and histograms, and deploying ANOVA with R, one-way ANOVA, and two-way ANOVA
K-Means clustering for cluster and affinity analysis, cluster algorithm, cohesive subset of items, solving clustering issues, working with large datasets, association rule mining affinity analysis for data mining, and analysis and learning co-occurrence relationships
Introduction to Association Rule Mining, various concepts of Association Rule Mining, various methods to predict relations between variables in large datasets, algorithm and rules of Association Rule Mining, and understanding single cardinality
Understanding what is simple linear regression, various equations of line, slope, Y-intercept regression line, deploying analysis using regression, the least square criterion, interpreting the results and standard error to estimate and measure of variation.
Scatter plots, two-variable relationship, simple regression analysis, and line of best fit
Deep understanding of measure of variation, the concept of co-efficient of determination, F-test, the test statistic with an F-distribution, advanced regression in R and prediction linear regression.
Logistic regression mean and logistic regression in R
Advanced logistic regression, understanding how to predict using logistic regression, ensuring if the model is accurate, understanding sensitivity and specificity, confusion matrix, what is ROC, a graphical plot illustrating binary classifier system and ROC curve in R for determining sensitivity/specificity trade-offs for a binary classifier.
Detailed understanding of ROC, area under ROC curve, converting the variable, data set partitioning, understanding how to check for multicollinearity, how two or more variables are highly correlated, building of model, advanced data set partitioning, interpreting of the output, predicting the output, detailed confusion matrix and deploying the Hosmer-Lemeshow test for checking whether the observed event rates match the expected event rates
Data analysis with R, understanding the Wald test, MC Fadden’s pseudo R-squared, the significance of the area under ROC curve, Kolmogorov–Smirnov chart which is a non-parametric test of one-dimensional probability distribution.
Connecting to various databases from the R environment, deploying the ODBC tables for reading the data and visualization of the performance of the algorithm using the confusion matrix
Creating an integrated environment for deploying R on Hadoop platform, working with R Hadoop, RMR package and R Hadoop integrated programming environment and R programming for MapReduce jobs and Hadoop execution.
Logistic Regression Case Study
In this case study, you will get a detailed understanding of the advertisement spends of a company that will help drive more sales. You will deploy logistic regression to forecast the future trends, detect patterns and uncover insights and more, all through the power of R programming. Due to this, the future advertisement spends can be decided and optimized for higher revenues.
Multiple Regression Case Study
You will understand how to compare the miles per gallon (MPG) of a car based on various parameters. You will deploy multiple regression and note down the MPG for the car make, model, speed, load conditions, etc. It includes the model building, model diagnostic and checking the ROC curve, among other things.
Receiver Operating Characteristic (ROC) Case Study
You will work with various data sets in R, deploy data exploration methodologies, build scalable models, predict the outcome with highest precision, diagnose the model that you have created with various real-world data, check the ROC curve and more.
This R programming training is designed for clearing the Intellipaat R Certification exam.
As part of this Data Science with R certification training, you will be working on real-time R programming projects and assignments that have immense implications in the real-world industry scenarios, thus, helping you fast-track your career effortlessly.
At the end of this R programming training, there will be a quiz that perfectly reflects the type of questions asked in the R certification exam and helps you score better marks.
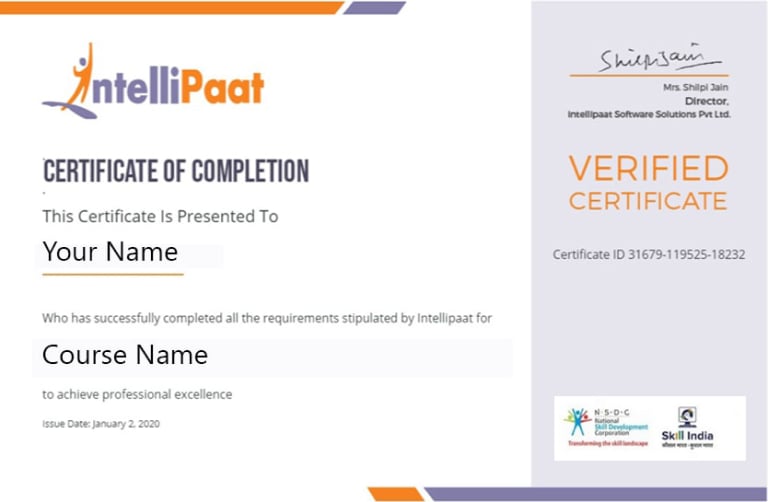
The R certification will be awarded upon the completion of the project work (after the expert review) and upon scoring at least 60% marks in the quiz. Intellipaat’s R certification is well recognized in top 80+ MNCs like Ericsson, Cisco, Cognizant, Sony, Mu Sigma, Saint-Gobain, Standard Chartered, TCS, Genpact, Hexaware, etc.
Land Your Dream Job Like Our Alumni

Intellipaat offers a comprehensive Data Science with R certification training for professionals who want to expand their knowledge base and start a career in this field. With this industry-designed R training, you will master various aspects of tools and concepts used in R programming including graphical representation, statistical analysis and reporting. This R programming online course will also make you proficient in the concepts of functions, data structures, variables and flow of control. Upon the successful completion of the R programming training, you will be awarded the Intellipaat R Certification.
Our job assistance program is aimed at helping you land your dream Data Science job. It offers a potential opportunity for you to explore various competitive openings in the corporate world and find a well-paid job, matching your profile. The final decision on hiring will always be based on your performance in the interview and the requirements of the recruiter.
Intellipaat does not directly forward resumes to any companies or recruiters. However, we do have a placement team that will conduct a number of mock interviews and will assist you in updating your resume to prepare you for Data Science job interviews. The team, thus, helps you land a lucrative job in the Data Science domain.
In the career mentoring session at Intellipaat, our R course experts offer solutions to all your queries that are based on Data Science career opportunities and the growth available in this domain.
Intellipaat selects subject matter experts from top MNCs, who have at least 8 to 12 years of experience in the Data Science domain, as instructors. They are qualified instructors for Data Science with R certification training and are selected after going through our rigorous selection process and proving their capabilities.
Intellipaat’s teaching assistants are SMEs whose main aim is to make you a certified professional in the respective domain. The Data Science trainers conduct interactive video lectures to teach the latest technologies and enrich your experience with various industry-based projects. The teaching assistance provided by Intellipaat is only available during regular hours.
Intellipaat provides various group offers and discounts for its R language course as per the size and type of the particular group. If you wish to avail the discount, you need to get in touch with our Data Science learning program advisors who will explain to you all the details regarding it.
3 technical 1:1 sessions per month will be allowed.
 Click to Zoom